Customer
Abu Dhabi Mobility, a transport center of the Abu Dhabi Department of Municipalities and Transport. The department manages public and cargo transportation by land, water, and air. It is responsible for building parking lots and bike lanes, monitoring traffic, and shaping a global vision of the transport system in the smart city. One of the latest high-profile projects of AD Mobility includes the transition to eco-friendly hydrogen and electric buses, along with the use of AI for traffic analysis to reduce congestion on Abu Dhabi streets.
Project partner Pixonal
Rubius developed a BI platform for Abu Dhabi urban mobility management in collaboration with its strategic partner, Pixonal. In this project, Pixonal is responsible for product concept and design.
Pixonal is the leading design and technology firm with specialization in developing immersive data-driven products and stories for world leaders and decision-makers. Some of their clients include PricewaterhouseCoopers, as well as the government of Dubai and Abu Dhabi.
Problem: Making decisions based on unstructured data can be challenging
AD Mobility is a data-driven center. It measures average speeds, the number of traffic jams and accidents, as well as where and what types of transport residents use. Additionally, it tracks real estate usage across Abu Dhabi to assess the need for buses, parking, and bike lanes. As it is, this data is just a set of numbers. It is difficult to track trends, plan transport system development, or address daily tasks like managing traffic lights and adjusting bus schedules.
To analyze such a large volume of information, AD Mobility employees have to prepare multipage reports and presentations. This process is time-consuming, and the data in the documents often remains unclear and quickly loses relevance.
Solution: BI platform for urban mobility management
To assist AD Mobility in managing the Abu Dhabi transport system, Rubius, in collaboration with Pixonal, developed a data fusion BI platform for smart mobility management in Abu Dhabi.
BI platform
A business intelligence platform (BI platform) is an interactive application for visualizing complex data. It gathers information from various sources (ERP, databases, sensors, cameras, etc.) and transforms it into visual graphs, charts, or tables. This format makes it easier for users to interpret large amounts of information. Unlike traditional presentations with similar graphs and charts, BI tools update data in real time, ensuring it remains relevant. Additionally, users can apply filters to analyze the information. For example, they can find out how much electricity the organization consumed over six months or how many employees worked on company sites yesterday.
BI platforms are universal. They are used in industry, trade, energy, and financial sector, logistics, construction and public administration.
How BI helps manage a Smart City
BI platforms gather and analyze large amounts of information. It includes the operation of public utilities, hospitals, schools, road conditions, parking lots, energy consumption, air pollution levels, the number of water pipeline failures, and traffic accidents. The greater the level of digitalization in an area, the more indicators can be analyzed in real time.
How BI operates Abu Dhabi infrastructure
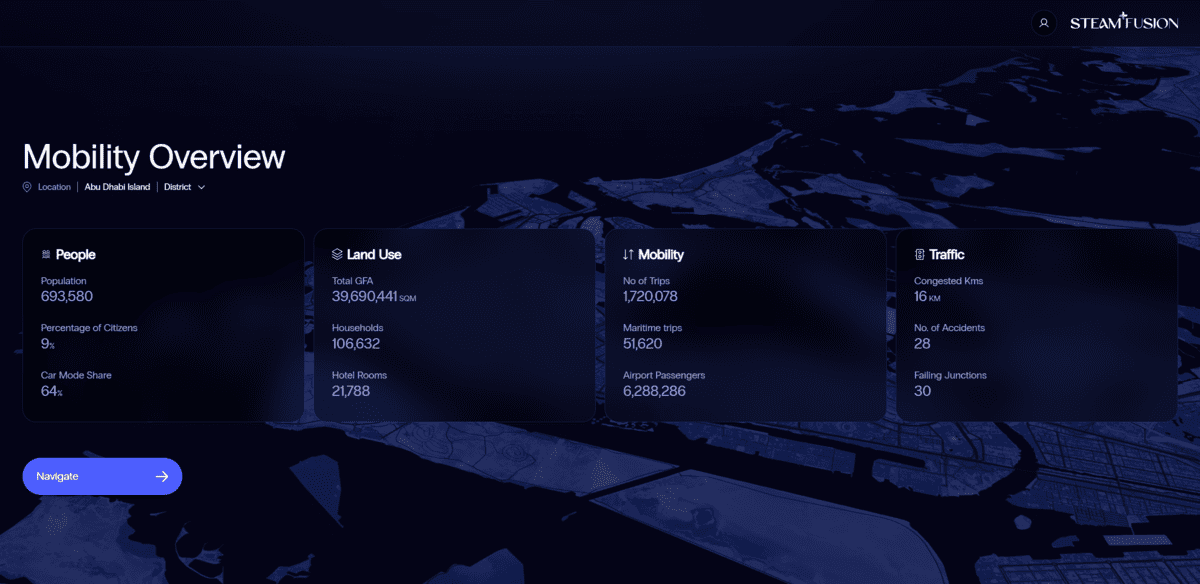
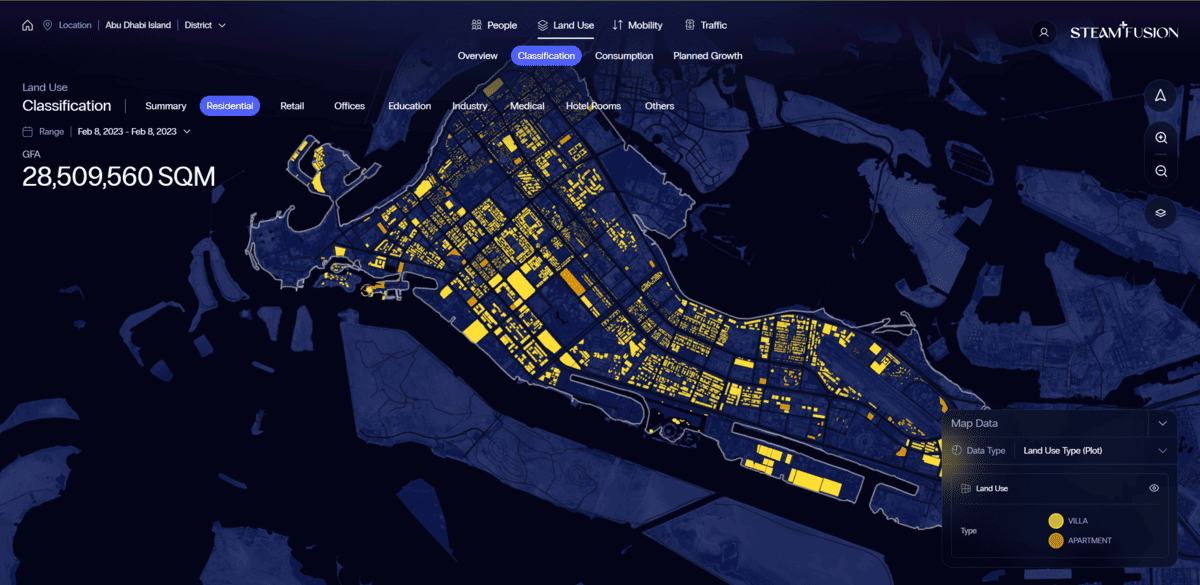
The developed BI platform serves as an insightful, structured, and engaging tool to navigate the comprehensive data fusion catalog of Abu Dhabi’s traffic, mobility, population, and urban development information. It provides instant access to over 70 billion data points and the latest custom data visualizations. The BI platform empowers the top leadership of Abu Dhabi’s transport system by enabling instant access and streamlining meaningful communication of key strategic insights, essential to a data-driven decision-making process.
Module for fast planning. To quickly assess the situation, the most important indicators are displayed on the start screen of the application. In just a few minutes, users can find key data, such as the population of Abu Dhabi, the number of households and hotel rooms, road length, the number of trips, accidents, and problematic junctions.

